by Reza Akhavan and Bita Abbasi
For a standard approach to read head/brain computed tomography (CT) scan, one should adhere to systematic algorithms.
The predefined algorithms are various, and their main usage is building a mental pathway that leads the novice readers not to miss a point. Our recommended algorithm is shown in figure 1.
Figure 1: Step by step approach to brain CT in emergency situations

In the interpretation of head CT, the most critical diagnoses for emergency physicians are hemorrhage or ischemic stroke, and midline shift. These diagnoses or pathologies require immediate action. Therefore, checking the brain parenchyma is the first step for emergency physicians.
1. Brain Parenchyma
Midline shift
Presence of mass effect from edema or space-occupying lesions may cause a shift in midline structures. The shift of midline may cause compression on the anterior cerebral artery and eventually infarct. There are multiple sulci and cisterns in the brain that are filled with CSF. The presence of effacement in these structures is another sign for the presence of a space-occupying lesion or parenchymal edema.
A note on anatomy (figures 2 and 3)
There are three midline structures that should be scrutinized when searching for midline shift:
- Septum pellucidum: a membrane located between lateral ventricles
- Third ventricle
- Pineal gland
All these three structures should be on the line drawn between anterior and posterior attachments of the falx cerebri.
*: Bold and underlined structures are marked in accompanying figure.
Figure 2: Axial brain C scan (a) and its corresponding schematic view (b) depict the midline structures. Falx cerebri (green), septum pellucidum (magenta), third ventricle (yellow) and pineal gland (orange) should be located in the midline.

Figure 3: Axial non-contrast brain CT scan shows an ICH in the right parietotemporal lobe (arrow in a) with adjacent edema. SAH is seen in the brain sulci (arrowhead in a). Red-line in (b) represents the midline. Note the deviation of septum pellucidum (blue line), third ventricle (yellow line), and pineal gland (green line).

Abnormal parenchymal hyperdensity
Intraparenchymal hemorrhages manifest as hyperdense areas in brain parenchyma and are really difficult to miss! They are generally categorized as spontaneous or secondary to neoplasms, vascular malformations or trauma, etc.
Spontaneous hemorrhage
Also known as hemorrhagic stroke, spontaneous intracranial hemorrhages most commonly occur in hypertensive patients. The most common locations are basal ganglia, thalamus, pons, and cerebellum. Hemorrhages outside these common locations may be secondary to tumors or vascular malformation.
A note on anatomy (figures 4 and 5)*
Deep grey matter nuclei are islands of grey matter located deep in the brain:
- Thalamus
- Putamen
- Globus pallidus
- Caudate nucleus
Caudate nuclei, putamen and globus pallidus are collectively known as basal ganglia. Internal capsule is a white matter structure located adjacent to deep nuclei.
*: Bold and underlined structures are marked in accompanying figure.
Figure 4: Axial brain CT scan (a) and corresponding schematic picture (b) represent the basal ganglia and associated structures. Red: head of caudate nucleus, Green: Globus pallidus, Blue: Putamen, Pink: Thalamus, Yellow: internal capsule.

Figure 5: Axial brain CT scan of a 57-year-old woman that presented with left-sided paraparesis, shows a hyperdense hemorrhage in the right basal ganglia (asterisk). Note the adjacent hypodense edema (black arrow) and mass effect on the lateral ventricle (white arrow).

Secondary hemorrhage
The most common secondary parenchymal hemorrhages encountered in the emergency departments are traumatic. Traumatic hemorrhages may be intra-axial (within brain parenchyma) or extra-axial. Intra-axial hemorrhages like contusions or hemorrhagic diffuse axonal injuries are discussed here. Extra-axial hemorrhaged will be discussed later.
Contusion
Contusions are caused by impaction of brain parenchyma on hard bony protrusions, so direct contact with bony protrusions affects cortical grey matter (figure 6). They are most commonly seen in frontal and temporal lobes (figure 7). They are often hemorrhagic and easily seen on computed tomography. In the control CT scans after a few days, the perilesional edema progresses, and the lesions become more readily visible.
Figure 6: Schematic representation of common locations for the contusion. Contusions most commonly occur in inferior portions of the frontal lobe, temporal lobe, underneath the direct impact (coup) or at the opposite site of direct impact (countre-coup).

Figure 7: Axial brain CT scan in a trauma patients shows multiple hemorrhagic lesions in the right frontal (a) and right temporal (b) lobes consistent with contusions. Note the perilesional hypodense edema.

Diffuse axonal injury
In case of rotational acceleration traumas (brain traumas associated with rotations and change of speed), white matter and grey matter experience slightly different changes of speed. This disrupts axons at the grey-white interfaces (figure 8). This kind of lesion is called diffuse axonal injury (DAI).
Figure 8: Schematic representation of diffuse axonal injury. Rotational forces disrupt the axons at grey-white junctions.

Unfortunately, only 15% of DAIs are visible on CT scan. MRI remains the most sensitive modality for detecting these lesions. When visible on CT, they present as hemorrhagic foci in the grey-white interface, near deep nuclei of the brain and in the corpus callosum (figure 9).
Figure 9: Axial non-contrast brain CT scan of a 34 y/o male from a motor vehicle accident. Multiple hyperdense hemorrhagic lesions are seen in the grey-white junction (a), adjacent to thalamus (b) and corpus callosum (c). Multiplicity and location of the lesions are compatible with diffuse axonal injury.

Abnormal parenchymal hypodensity
In most cases, abnormal hypodensities represent cerebrovascular accidents (involves the cortex) or edema secondary to other pathologies (usually without cortical involvement). Stroke is defined as acute onset of focal neurologic defect due to cerebrovascular compromise. Most strokes are ischemic (80%), and some are hemorrhagic (15%). Subarachnoid hemorrhage accounts for the remaining 5%.
Brain CT scan findings in ischemic stroke are mainly a factor of time and involved artery.
- In the first hours of a stroke, thrombosis in the supplying artery creates a hyperdense artery sign. This is the earliest imaging finding of acute stroke in non-contrast CT scan (figure 10).
Figure 10: Axial non-contrast CT scan of a 63 y/o man with sudden onset right hemiparesis shows hyperdensity in the middle cerebral artery. This finding –being the result of arterial thrombosis- is the earliest finding in the CT scan of acute ischemic stroke. If you are able to discern the sign and diagnose a stroke in this phase, be proud of yourself!

- Another imaging finding in non-contrast CT scan is the loss of grey-white differentiation
- Cortical hypodensity (figure 11) and sulcal effacement (figure 12) are relatively late signs of stroke.
Figure 11: Axial non-contrast brain CT in a 49 y/o woman presented to the emergency medicine with a 3-day history of dysarthria and right-sided motor weakness. There is cortical hypodensity in the left frontal lobe (arrow) that represents ischemic infarct in the territory of the anterior cerebral artery.

Figure 12: Axial non-contrast CT shows a faint hypodense area in the left frontoparietal area suggesting ischemic stroke. Sulcus effacement is noted in comparison to the other side (arrow). Note the subtlety of findings in the acute phase of stroke.

2. Extra-axial spaces
Extra-axial spaces are defined as the space within the skull that is not part of brain parenchyma. Meningeal layers engulf the parenchyma and separate it from the calvarium.
The meninges are composed of three layers: pia mater (that is in direct contact with grey matter and contains supplying capillaries), arachnoid network (that contains CSF and absorbs it into dural veins via arachnoid granulations) and dura mater (that is in direct contact with periosteum). The layers are depicted schematically in figure 13.
Figure 13: Schematic representation of meningeal layers.

The most common extra-axial pathologies are traumatic.
Epidural hematoma
Epidural space is a potential space located between the periosteum and dura mater. These layers have a tight connection, and it takes a considerable amount of force for them to be separated. In practice, epidural hematomas are mostly due to arterial hemorrhage (especially middle meningeal artery) and are usually associated with skull fractures (figure 14).
Figure 14: Schematic representation of epidural hematoma. Note that epidural hematomas do not cross suture lines and may be associated with skull fractures.

Epidural hematomas appear as biconvex or lentiform hyperdensity in the brain periphery (figure 15). They may cross the midline but do not cross the sutures. This is because of the attachment of dura to the sutures.
Figure 15: Axial non-contrast brain CT scan shows a lentiform epidural hematoma in the right hemisphere.

Subdural hematoma
Subdural space is a potential space between the inner layer of dura and arachnoid membrane (figure 16). Hematomas within subdural space are usually due to rupture of bridging veins located in this areas.
Figure 16: Schematic representation of subdural hematoma. Note that subdural hematomas may cross the suture lines, but do not cross the midline.

Subdural hematomas appear as crescent-shaped collections of blood overlying the cerebral hemispheres (figure 17). They may cross the sutures or track along the falx or tentorium, but do not cross the midline.
Figure 17: axial non-contrast brain CT scan shows an acute SDH in the left hemisphere with midline shift.

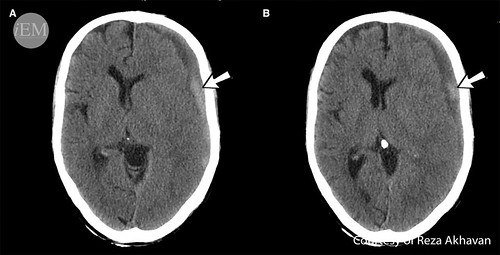
As time progresses, the density of SDH decreases. Therefore subacute SDH is isodense to brain parenchyma and becomes gradually hypodense in chronic stages. In the subacute phase, SDH may not be readily discernible, and attention to the midline shift helps in diagnosis (figure 18).
Figure 18: Axial brain CT-scan reveals a midline shift. As a novice image interpreter, you may see no other pathologies. Look carefully at the left hemisphere! What appears as a thickened cortex, is actually an isodense subacute SDH, hence known as thick cortex sign.

The layered appearance of SDH is a sign of active rebleeding. Call the neurosurgeon immediately (figure 19)!
Figure 19: Axial non-contrast brain CT scan shows the chronic phase of epidural hematoma. There are areas of increased density (arrows in a and b) in the EDH that are compatible with active rebleeding.
Subarachnoid hemorrhage (SAH)
Subarachnoid space is the space between subarachnoid membrane and pia mater. The space contains CSF and extends into brain sulci and cisterns. In the CT scan, SAH is seen only in the acute phase and presents as hyperdensity within the sulci and cisterns (figures 20-22).
Figure 20: This patient presented to the ED complaining of a severe headache. Axial non-contrast brain CT-scan shows hyperdense SAH in the basal cisterns (white arrow) and right-sided Sylvian fissure (black arrow). Note the hypodensity in the adjacent parenchyma that represents secondary edema.

Figure 21: Axial non-contrast brain CT scan shows hyperdensity in the basal cisterns and Sylvian fissures (arrow), which is compatible with SAH.

Figure 22: Axial non-contrast brain CT scan of a trauma patient, reveals hyperdensity in a sulcus in brain convexity that suggests SAH.

Subarachnoid hemorrhages may be traumatic or non-traumatic. Traumatic SAH is usually associated with SDH. Non-traumatic SAH is usually due to a ruptured berry aneurysm.
Dural vein thrombosis
Dural veins are located between dural layers. Increased density in these structures is a sign of dural vein thrombosis.
A note on anatomy (figures 23 and 24)*
Dural veins are venous structures of the brain that are located between dural layers. In addition of draining venous blood, they have the critical task of CSF resorption. Dural vein thrombosis causes increased pressure in the venous structures and may lead to infarcts and hemorrhages. This may also cause increased intracranial pressure by hindering CSF resorption.
*: Bold and underlined structures are marked in accompanying figure.
Figure 23: A schematic view of main dural veins and their correspondence on axial brain CT scans. Superior sagittal sinus (a and b), straight sinus (c), transverse sinuses (d) and sigmoid sinuses (e) are outlined on the CT images.

Figure 24: Axial non-contrast brain CT scan shows increased density in the posterior part of superior sagittal sinus indicating thrombosis (arrowhead). There is also a hyperdense intracranial hematoma (ICH) in the left parietal lobe (arrow) with adjacent edema. Remember that intraparenchymal hematoma is due to impairment of blood flow and venous infarct secondary to dural vein thrombosis.

Intraventricular hemorrhage (IVH)
The most common cause of IVH in adults is trauma. Blood in the ventricles could enter the structure from adjacent parenchymal hemorrhage or blood in the subarachnoid space (SAH) may enter the ventricle via CSF flow (figure 25).
Figure 25: A 55 y/o man presented with sudden loss of consciousness. Axial non-contrast brain CT scan (a) shows ICH in the right temporal lobe (black arrow), SAH in basal cisterns (white arrows in a) and IVH in the fourth ventricle (arrowhead). As the ICH was located outside the common locations of spontaneous ICH, a CT angiography of cerebral vessels was performed (b). In CT angiography an outpouching of contrast was noted (white arrow in b) that is consistent with an aneurysm.

Hydrocephalus
Hydrocephaly or dilatation of ventricles (figure 26) may be the result of mass-occupying lesion that obstructs CSF flow in ventricular structures or may be due to impairment of CSF resorption via subarachnoid granulations.
Figure 26: Axial non-contrast brain CT scan shows dilatation of lateral ventricles that suggests hydrocephaly.

3. Bones
The presence of skull fractures is not always a sign of underlying brain injury. However, the significant amount of force that causes a skull fracture mandates careful evaluation of other associated intracranial injuries.
Simple linear fractures are the most common types of skull fractures and appear as linear hypodense lines in the skull. Depressed skull fractures are usually accompanied with contusions in the underneath brain parenchyma (figure 27).
Figure 27: Axial brain CT-scan in a young man with a shotgun injury. Bone window (a) reveals a depressed skull fracture (arrow in a). Note the hyperdense pellet embedded near the fracture. Parenchymal window (b) shows a contusion (arrow in b) in the adjacent parenchyma.

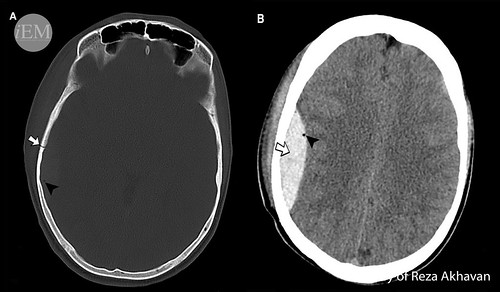
Warning signs in a skull fracture include the presence of intracranial air (pneumocephalus)(figure 28), depression of inner table of calvarium (depressed fracture), overlying scalp laceration (open skull fracture), or fractures adjacent to dural veins or middle meningeal artery (figure 28). Whenever you encounter a skull fracture, look carefully at these red flags!
Figure 28: Axial non-contrast brain CT scan in a trauma patient. Bone window (a) shows a linear skull fracture (arrow in a). The location of the fracture near middle meningeal artery and presence of pneumocephalus (arrowheads in a and b) warrants further evaluation. Parenchymal window (b) depicts an epidural hematoma (arrow in b) that is secondary to the rupture of the middle meningeal artery.
Finally, note the visible parts of paranasal sinuses and look for possible fractures. The presence of air-fluid levels or hyperdensity within the sinuses might be an indication of fracture in the trauma setting (figure 29)
Figure 29: Axial non-contrast bone window CT scan of the brain shows a fracture in the anterior wall of the left maxillary sinus (arrow). The air-fluid level within the sinus (arrowhead) indicates hemorrhage.

Another CT head interpretation mnemonic is BLOOD CAN BE VERY BAD. We will not go over all details of this mnemonic, but we have an infographic for you. Please visit our Flickr channel for more pathologic CT scan images.

References and Further Reading
- Chiewvit P, Tritakarn SO, Nanta-aree S, Suthipongchai S. Degree of midline shift from CT scan predicted outcome in patients with head injuries. Journal of the Medical Association of Thailand = Chotmaihet thangphaet. 2010;93(1):99-107.
- Zasler ND, Katz DI, Ross D. Zafonte D. Brain Injury Medicine, 2nd Edition: Principles and Practice: Springer Publishing Company; 2012.
- Marx JA, Hockberger RS, Walls RM, Adams J. Rosen’s Emergency Medicine: Concepts and Clinical Practice: Mosby/Elsevier; 2010.
- Sacco RL, Kasner SE, Broderick JP, Caplan LR, Connors JJ, Culebras A, et al. An updated definition of stroke for the 21st century: a statement for healthcare professionals from the American Heart Association/American Stroke Association. Stroke; a journal of cerebral circulation. 2013;44(7):2064-89.
- Flint AC, Manley GT, Gean AD, Hemphill JC, 3rd, Rosenthal G. Post-operative expansion of hemorrhagic contusions after unilateral decompressive hemicraniectomy in severe traumatic brain injury. Journal of neurotrauma. 2008;25(5):503-12.
- D’Avella D, Cacciola F, Angileri FF, Cardali S, La Rosa G, Germano A, et al. Traumatic intracerebellar hemorrhagic contusions and hematomas. Journal of neurosurgical sciences. 2001;45(1):29-37.
- Tomandl BF, Klotz E, Handschu R, Stemper B, Reinhardt F, Huk WJ, et al. Comprehensive imaging of ischemic stroke with multisection CT. Radiographics : a review publication of the Radiological Society of North America, Inc. 2003;23(3):565-92.
- Ganz JC. The lucid interval associated with epidural bleeding: evolving understanding. Journal of neurosurgery. 2013;118(4):739-45.
- Datta S, Stoodley N, Jayawant S, Renowden S, Kemp A. Neuroradiological aspects of subdural haemorrhages. Archives of disease in childhood. 2005;90(9):947-51.
- Davenport R. Acute headache in the emergency department. Journal of neurology, neurosurgery, and psychiatry. 2002;72 Suppl 2:ii33-ii7.
- Bogousslavsky J, Caplan LR. Stroke Syndromes: Cambridge University Press; 2001.
- Novelline RA, Squire LF. Squire’s Fundamentals of Radiology: Harvard University Press; 2004.
- Brant WE, Helms CA. Fundamentals of Diagnostic Radiology: Lippincott, Williams & Wilkins; 2007.
Links To More Information
- http://radiopaedia.org/articles/intracerebral-haemorrhage
- http://radiopaedia.org/articles/cerebral-haemorrhagic-contusion
- http://radiopaedia.org/articles/diffuse-axonal-injury
- http://radiopaedia.org/articles/midline-shift
- http://radiopaedia.org/articles/ischaemic-stroke
- http://radiopaedia.org/articles/extradural-haemorrhage-basic
- http://radiopaedia.org/articles/subdural-haemorrhage-basic
- http://radiopaedia.org/articles/subarachnoid-haemorrhage-basic
- http://radiopaedia.org/articles/dural-venous-sinus-thrombosis
- http://radiopaedia.org/articles/intraventricular-haemorrhage
- http://radiopaedia.org/articles/hydrocephalus
- http://radiopaedia.org/articles/skull-fractures-basic