by Rasha Buhumaid
Why use POCUS in undifferentiated hypotension?
Hypotension is a high-risk sign which is associated with increased morbidity and mortality rate. The differential diagnosis for hypotension is broad and the treatment depends on the underlying etiology. In most cases of hypotension, patients present with limited history and physical examination may be inaccurate making the management of the condition a great challenge for emergency physicians.
The use of POCUS in undifferentiated hypotension has been shown to help correctly and rapidly identify the etiology and therefore initiate the appropriate management. Since 2001, there are many protocols published describing a systematic approach to the use of POCUS in undifferentiated hypotension. Table 1 summarizes the components of these protocols. In this chapter, we will review the Rapid Ultrasound in Shock (RUSH) protocol.
Equipment: Ultrasound machine with a linear probe (10-5 MHz) and phased array (5-1 MHz) or curved array (5-2 MHz) probe.
The RUSH protocol
The RUSH protocol (Rapid Ultrasound in Shock and Hypotension) uses the analogy of plumping system to categorize the causes of shock into three categories: The pump, the tank, and the pipes. The categories are assessed using specific and straightforward questions described below.
Step 1 – Pump: Cardiac Evaluation
The basic echocardiography views summarized in this tutorial (Video 1).
This step is used to evaluate the pump (the heart) for the following:
A. Determine the presence of pericardial effusion
Pericardial effusion will lead to hypotension when the fluid surrounding the pericardium causes obstructive physiology preventing the venous return to the heart. This is known as cardiac tamponade. Pericardial effusion and tamponade can easily be identified using POCUS.
Technique: any of the above described basic echocardiography views can be used to assess for pericardial effusion.
Interpretation: Pericardial effusion will appear as anechoic (black) fluid surrounding the heart (Figure1). The ultrasound finding of cardiac tamponade includes circumferential pericardial effusion with hyperdynamic heart swinging in the pericardial sac (Video 2). Right atrial wall diastolic collapse and right ventricular early diastolic collapse is also known as scalloping (Video 3).
Figure 1: Pericardial effusion marked by * in parasternal long view (A), parasternal short view (B), subxiphoid view (C) and apical 4 chamber view (D)

Video 2: Circumferential pericardial effusion with hyperdynamic left ventricle and swinging of the heart in the pericardial sac in a parasternal long view (A) and parasternal short view (B)
Video 3: Subxiphoid view demonstrating pericardial effusion with diastolic collapse of the Right Atrial (RA) wall
Pitfalls: Two important conditions can be confused with pericardial effusion.
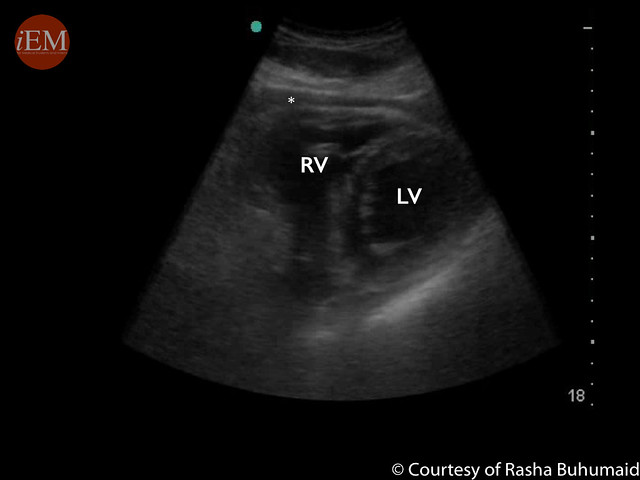
- Pericardial fat pad (Figure 2) which is not usually anechoic (black) but rather has some echogenicity (gray) and it is usually confined to the anterior wall above the right ventricle.
Figure 2: Fat pad marked by * above the Right Ventricle (RV) wall in a parasternal short view
- Pleural effusion can be confused with pericardial effusion in a parasternal long view. This can be differentiated using the descending aorta as a landmark in parasternal long view. A pericardial effusion will track above the descending aorta while pleural effusion will track below the descending aorta (Figure 3).
Figure 3: Parasternal long view demonstrating pericardial effusion tracking above the Descending Aorta (DA) and pleural effusion tracking below the DA

B. Assess Left Ventricular (LV) contractility
In the setting of hypotension, severely decreased LV contractility can help identify possible cardiogenic shock while hyperdynamic LV could result from severe hypovolemia, acute blood loss or early septic shock.
Technique: Any of the basic echocardiography views can be used to assess LV contractility.
Interpretation: The contractility of the LV can be evaluated by visual assessment of the difference in the LV volume between the end of systole and diastole. In normal LV contractility, there is a significant change in the volume of the LV between systole and diastole (Video 4). However, in a poorly contracting LV, there is a small change in the size of the LV volume during the cardiac cycle (Video 5). Using this method, the LV contractility can be broadly categorized into 4 categories; normal, mild to moderately decreased, severely decreased and hyperdynamic LV. Hyperdynamic LV is when the volume changes between systole and diastole more than 70% or the walls of the LV touch during systole (Video 6). Studies have shown that qualitative visual assessment correlates well with the quantitative techniques used by cardiologists.
Video 4: Normal Left Ventricular (LV) contractility in parasternal lone view (A) and parasternal short view (B)
Video 5: Severely decreased LV contractility in parasternal long view (A) and parasternal short view (B)
Video 6: Hyperdynamic LV contractility in parasternal long view
Pitfalls: In some cases of cardiogenic shock, LV contractility will be preserved, for example, acute severe valvular regurgitation and acute right ventricular infarction.
C. Assess for Right Ventricle (RV) strain
In the right clinical setting, hypotension with signs of RV strain could be a sign of massive pulmonary embolism causing obstructive shock.
Technique: using parasternal short view and apical 4 chamber view can identify signs of RV strain.
Interpretation: the signs of RV strain include 1) RV enlargement: best assessed in apical 4 chamber view. Normally, the RV is smaller than the LV with a normal RV:LV ratio of 0.6:1. If RV/LV ration > 0.9 it suggests RV enlargement (Video 7). 2) The D sign: In a parasternal short view, bowing of the interventricular septum towards the LV indicate increase pressure in the RV (Video 8).
Video 7: Apical 4 chamber views with normal Right ventricle (RV) size (A) and enlarged RV (B)
Video 8: Parasternal short views with normal interventricular septum (A) and D sign: bowing of the interventricular septum towards the LV (B)
Pitfalls:
- The apical 4 chamber view can be a challenging view to obtain due to technical difficulty the view might be foreshortened (the apex appears rounded rather than bullet shape), this will lead to overestimation of the RV size.
- An important pitfall to consider when evaluating for signs of RV strain is that RV dilation is not specific for massive pulmonary embolism. Any condition that increases the pressure of the right heart will lead to dilated RV including chronic COPD and pulmonary hypertension. However, the RV wall is likely to be thick in chronic conditions.
- It is important to note that normal RV on echocardiography does not rule out pulmonary embolism.
Step 2 – Tank: Volume Status Evaluation
A. Tank fullness: Inferior Vena Cava (IVC) evaluation
In spontaneously breathing patient, during inspiration, the negative intra-thoracic pressure will increase venous return to the heart leading to IVC collapse which is reversed during expiration. This physiology is reversed in ventilated patients. During insufflation, the intra-thoracic pressure increases, decreasing the venous return and the IVC expands, this is reversed during expiration. Studies have shown that the degree of IVC size change during the respiratory cycle can be used to predict volume responsiveness.
Technique: using a low frequency probe in a longitudinal plane in the subxiphoid area the IVC is identified as a vessel draining into the right atrium (Video 9). The IVC can be assessed using 2 methods: qualitative and quantitative. The qualitative method is by visual assessment of the size and collapsibility with respiratory cycle (Video 10). The quantitative method is by calculating the percentage of IVC collapsibility with respiratory variation also known as the Caval Index (CI). Using M mode, the IVC size measured 2 cm from the right atrial junction during inspiration and expiration. The CI (%) = (IVC expiratory diameter – IVC inspiratory diameter)/ IVC expiratory diameter × 100 (Figure 4).
Video 9: Tutorial on ultrasound of the Inferior Vena Cava
Video 10: A: small and collapsible IVC with respiration. B: large and non-collapsible IVC with respiration
Figure 4: M mode evaluation of the IVC: (A) shows a small and collapsible IVC with respiration and Caval Index= 60%. (B) shows a large IVC with minimal respiratory variation and Caval Index = 3%

Interpretation: In spontaneously breathing patients, collapsible IVC or caval index more than 40% is associated with volume responsiveness. While dilated non-collapsible IVC does not rule out volume responsiveness.
Pitfalls:
- The IVC can be mistaken for the abdominal aorta. This can be avoided by visualizing the IVC drain into the right atrium while the abdominal aorta passes behind the heart.
- Interpreting the findings of IVC assessment alone can be misleading as there are numerous causes of dilated non-collapsible IVC including tension pneumothorax, massive pulmonary embolism and pericardial tamponade.
B. Tank Leakiness: FAST Exam
In atraumatic hypotension, intrabdominal free fluid could be due to ruptured abdominal aortic aneurysm, ruptured ectopic pregnancy or ruptured hemorrhagic ovarian cyst.
Technique: the scanning technique for Intraperitoneal free fluid is described in details in the eFAST chapter (eFAST by Ashley Bean and Gregory R. Snead)
Interpretation: Intraperitoneal free fluid is identified as anechoic (black) fluid collection in any of the following areas. In the right upper quadrant view, fluids will accumulate in the hepatorenal space also known as Morrison’s pouch. In the left upper quadrant view, fluids will accumulate in the subdiaphragmatic space that can extend into the splenorenal space. In the pelvic view, fluid will accumulate in rectouterine space also known as the pouch of Douglas in females and rectovesical space in males. (Figure 5)
Figure 5: FAST exam demonstrating free fluid marked by (*) in the hepatorenal space (A), subdiaphragmatic and spleenorenal space (B), rectovesical space(C) and pouch of Douglas (D)

Pitfalls:
Free fluid in the peritoneal cavity can be urine or previous ascites. Ultrasound cannot differentiate these fluids. However, in a patient with shock and hypotension, this free fluid is considered as blood until proven otherwise.
C. Tank Overload: Assessment of pleural effusion and pulmonary edema
In the setting of hypotension, decreased LV contractility, dilated non-collapsible IVC, signs of pulmonary edema and bilateral pleural effusion suggests cardiogenic shock.
Technique: Using a low frequency probe, assess for pleural effusion by obtaining the same views used for the FAST exam. Start with the coronal views of the right upper quadrant and left upper quadrant then move the probe cephalad (towards the head) to visualize the pleural cavity better; space above the diaphragm (Video 11). To assess for pulmonary edema, use a low frequency probe to obtain a longitudinal lung view of the anterior chest wall, locate two ribs (hyperechoic area with posterior shadowing) and identify the pleural line (hyperechoic line) between the rib shadows (Video 12).
Video 11: Tutorial on lung ultrasound for pleural effusion
Video 12: Tutorial on lung ultrasound for pulmonary edema
Interpretation:
Pleural effusion is confirmed if a black/anechoic fluid is identified above the diaphragm or by visualizing the thoracic vertebra body (hyperechoic-white line with posterior shadowing) extending above the diaphragm also known as positive spine sign (Figure 6).
Figure 6: (A) Right upper quadrant view with normal pleural space. (B) Right upper quadrant view with evidence of pleural effusion (*) and positive spine sign

In normally aerated alveoli, the pleural line will produce reverberation artifact known as A-lines. However, in case of fluid-filled alveoli, lung ultrasound will produce B lines: hyperechoic-white vertical lines extending from the pleural line into the far field. In case of pulmonary edema, B lines will be bilateral and in all lung zones (Video 13).
Video 13: Lung ultrasound (A) A-lines in the normal aerated lung. (B) B lines extended from the pleural line to the far field indicating fluid-filled alveoli
Pitfalls: B-lines are not specific for pulmonary edema. Any pathology that will fill the alveoli with fluids including ARDS and bilateral pneumonia will produce bilateral B-lines on lung ultrasound.
D. Tank Compromise: Assessment for pneumothorax
Tension pneumothorax is another cause of obstructive shock.
Technique: using a high frequency (linear) probe, obtain a longitudinal view of the lung between 3rd and 4th intercostal space, mid-clavicular line (Video 14).
Video 14: Tutorial on lung ultrasound for pneumothorax
Interpretation: Assess the pleural line for sliding with respiration either by visual evaluation or using M-Mode. The presence of lung sliding, seen as seashore sign on M mode rules out pneumothorax with 100% negative predictive value. In the absence of lung sliding also seen as barcode sign on M mode (Video 15) continue following the pleural line inferiorly and laterally to identify the boundary of pneumothorax known as lung point. A lung point on ultrasound will appear as a boundary between the absence of pleural sliding and normal pleural sliding (Video 16). The lung point is very specific for pneumothorax.
Video 15: (A) Lung ultrasound with normal pleural sliding. (B) Lung ultrasound with absence of pleural sliding. (C) M mode demonstrating seashore sign indicating normal pleural sliding. (D) M mode demonstrating barcode sign indicating absence of lung sliding
Video 16: Lung point which is the boundary between absence of lung sliding and normal lung sliding
Pitfalls: The absence of lung sliding could be from numerous causes other than pneumothorax including: pleurodesis, pleural bleb, poor respiratory effort and mainstem intubation.
Step 3 – Pipes: Vascular system Evaluation
A. Assessment for Abdominal Aortic Aneurysm (AAA)
A ruptured aortic aneurysm is a cause of non-traumatic hemorrhagic shock.
Technique: Using a low frequency probe. The aorta is scanned in a transverse view starting in the subxiphoid area. The landmark used to identify the aorta is the vertebral body (hyperechoic-white structure with posterior shadowing). The aorta is located anterior and to the left of the vertebral body. The aorta is traced caudad (toward the feet) until it bifurcates into the common iliac arteries at the level of the umbilicus (Video 17).
Video 17: Tutorial on ultrasound for abdominal aortic aneurysm
Interpretation: The abdominal aorta is measured from outer wall to outer wall at the proximal, middle and distal aorta. Normal abdominal aorta measures less than 3 cm. AAA is defined as abdominal aorta measuring greater than 3 cm (Figure 7) and the risk of rupture increases when it is greater than 5 cm.
Figure 7: (A) Normal abdominal aorta. (B) Abdominal aortic aneurysm measuring 4.8 cm with intramural thrombus

Pitfalls: The majority of ruptured AAA are retroperitoneal therefore when performing the FAST exam, no intraperitoneal free fluid will be identified. Always make sure that you are measuring the aorta from the outer wall to outer wall.
B. Assessment for clogged pipes: Deep Venous Thrombosis (DVT)
When considering pulmonary embolism as a cause of obstructive shock, obtaining adequate echocardiography views to assess for RV strain can challenging. In this situation, evaluating the extremities for DVT can be used as a surrogate marker for possible pulmonary embolism as literature shows that majority of pulmonary embolism originate from DVT.
Technique: using a low-frequency probe the 2 zone graded compression technique is used to identify DVT.
1) Assess the common femoral vein zone: place the probe in a transverse plane just below the inguinal ligament, identify the common femoral vein and greater saphenous vein. Trace the common femoral vein distally until it divides into the superficial and deep femoral vein.
2) Assess the popliteal zone: place the probe in a transverse plane in the popliteal fossa, identify the popliteal vein which is located on top of the popliteal artery. Trace the popliteal vein until it trifurcates distally. Apply graded compression on all the veins identified to ensure complete collapsibility of the veins (Video 18).
Video 18: Tutorial on ultrasound for DVT
Interpretation: Normally the veins are collapsible, failure to compress the vein (Video 19) or identification of echogenic material in the vein lumen suggests DVT (Figure 8).
Video 19: (A) Normal compressible left Common Femoral Vein (CFV). (B) Non- compressible left CFV suggesting a DVT
Figure 8: Echogenic material in the right Common Femoral Vein (CFV) indicating a DVT

Pitfalls: The 2 zone technique can only be used in ambulatory patients as studies have shown that it might miss isolated deep femoral vein DVTs which are seen in patients with prolonged immobilization.
The RUSH protocol provides a systematic stepwise approach to help rapidly identify the etiology of undifferentiated shock summarized in video 20. The sequence of the protocol may be altered based on the clinician’s assessment of the clinical condition.
Video 20: Summary of the RUSH protocol
References and Further Reading
- Jones A. Nontraumatic Emergency Department Hypotension Predicts Sudden Unexpected In-hospital Mortality. Academic Emergency Medicine. 2006;13(5Supplement 1):S150-S150.
- Vazquez R, Gheorghe C, Kaufman D, Manthous C. Accuracy of bedside physical examination in distinguishing categories of shock. J Hosp Med. 2010;5(8):471-474.
- Jones A, Tayal V, Sullivan D, Kline J. Randomized, controlled trial of immediate versus delayed goal-directed ultrasound to identify the cause of nontraumatic hypotension in emergency department patients. Critical Care Medicine. 2004;32(8):1703-1708.
- Volpicelli G, Lamorte A, Tullio M et al. Point-of-care multiorgan ultrasonography for the evaluation of undifferentiated hypotension in the emergency department. Intensive Care Med. 2013;39(7):1290-1298.
- Rose J, Bair A, Mandavia D, Kinser D. The UHP ultrasound protocol: A novel ultrasound approach to the empiric evaluation of the undifferentiated hypotensive patient. The American Journal of Emergency Medicine. 2001;19(4):299-302.
- EMCrit A. Original RUSH Article. EMCrit. 2015. Available at: http://emcrit.org/rush-exam/original-rush-article/. Accessed April 2, 2016.
- Atkinson P, McAuley D, Kendall R et al. Abdominal and Cardiac Evaluation with Sonography in Shock (ACES): an approach by emergency physicians for the use of ultrasound in patients with undifferentiated hypotension. Emergency Medicine Journal. 2009;26(2):87-91.
- Seif D, Perera P, Mailhot T, Riley D, Mandavia D. Bedside Ultrasound in Resuscitation and the Rapid Ultrasound in Shock Protocol. Critical Care Research and Practice. 2012;2012:1-14.
- Liteplo A, Noble V, Atkinson P. My patient has no blood pressure: point-of-care ultrasound in the hypotensive patient – FAST and RELIABLE. Ultrasound. 2012;20(1):64-68.
- Noble V, Nelson B, Sutingco A. Manual Of Emergency And Critical Care Ultrasound. Cambridge: Cambridge University Press; 2007.
- Randazzo M, Snoey E, Levitt M, Binder K. Accuracy of Emergency Physician Assessment of Left Ventricular Ejection Fraction and Central Venous Pressure Using Echocardiography. Acad Emergency Med. 2003;10(9):973-977.
- Nagdev A, Merchant R, Tirado-Gonzalez A, Sisson C, Murphy M. Emergency Department Bedside Ultrasonographic Measurement of the Caval Index for Noninvasive Determination of Low Central Venous Pressure. Annals of Emergency Medicine. 2010;55(3):290-295.
- Muller L, Bobbia X, Toumi M et al. Respiratory variations of inferior vena cava diameter to predict fluid responsiveness in spontaneously breathing patients with acute circulatory failure: need for a cautious use. Critical Care. 2012;16(5):R188.
- Blaivas M, Lyon M, Duggal S. A Prospective Comparison of Supine Chest Radiography and Bedside Ultrasound for the Diagnosis of Traumatic Pneumothorax. Acad Emergency Med. 2005;12(9):844-849.
- Lichtenstein D, Menu Y. A Bedside Ultrasound Sign Ruling Out Pneumothorax in the Critically III. Chest. 1995;108(5):1345-1348.
- Lichtenstein D, Mezière G, Lascols N et al. Ultrasound diagnosis of occult pneumothorax. Critical Care Medicine. 2005;33(6):1231-1238.
- Lichtenstein D, Mezière G, Biderman P, Gepner A. The “lung point”: an ultrasound sign specific to pneumothorax. Intensive Care Med. 2000;26(10):1434-1440.
- Darling R, Messina C, Brewster D et al. Autopsy study of unoperated abdominal aortic aneurysms. The case for early resection. Circulation. 1977;56(3):II 161-164.
- Anderson F. A Population-Based Perspective of the Hospital Incidence and Case-Fatality Rates of Deep Vein Thrombosis and Pulmonary Embolism. Arch Intern Med. 1991;151(5):933.
- Adhikari S, Zeger W, Thom C, Fields J. Isolated Deep Venous Thrombosis: Implications for 2-Point Compression Ultrasonography of the Lower Extremity. Annals of Emergency Medicine. 2015;66(3):262-266.